Dockerized Redis performance on CentOS 7.5
ThreatMark AFS (Anti Fraud Suite) is a system that delivers real-time insights on the user behavior and risk associated with every user action within digital banking or similar applications. Similarly to other enterprise systems, AFS uses several open source components. The usage of such components naturally brings challenges around its deployment, maintenance, and performance.
Redis is one of these components. AFS relies on Redis as a cache and storage for session data, making it a critical piece of our infrastructure. Previously Redis was deployed, along with database, on bare OS (virtualized or bare-metal).
In an effort to converge to a cloud native infrastructure, we have decided that Redis is a good candidate for dockerization. The initial step is borderline trivial – Redis is already published on docker hub as a versioned image, which allows us to pull it, run it and be done with it. Or not? Before modifying the Redis deployment, we have decided to run multiple tests to see whether the container overhead is low enough to be tolerable. And that is the point where things turn sour.
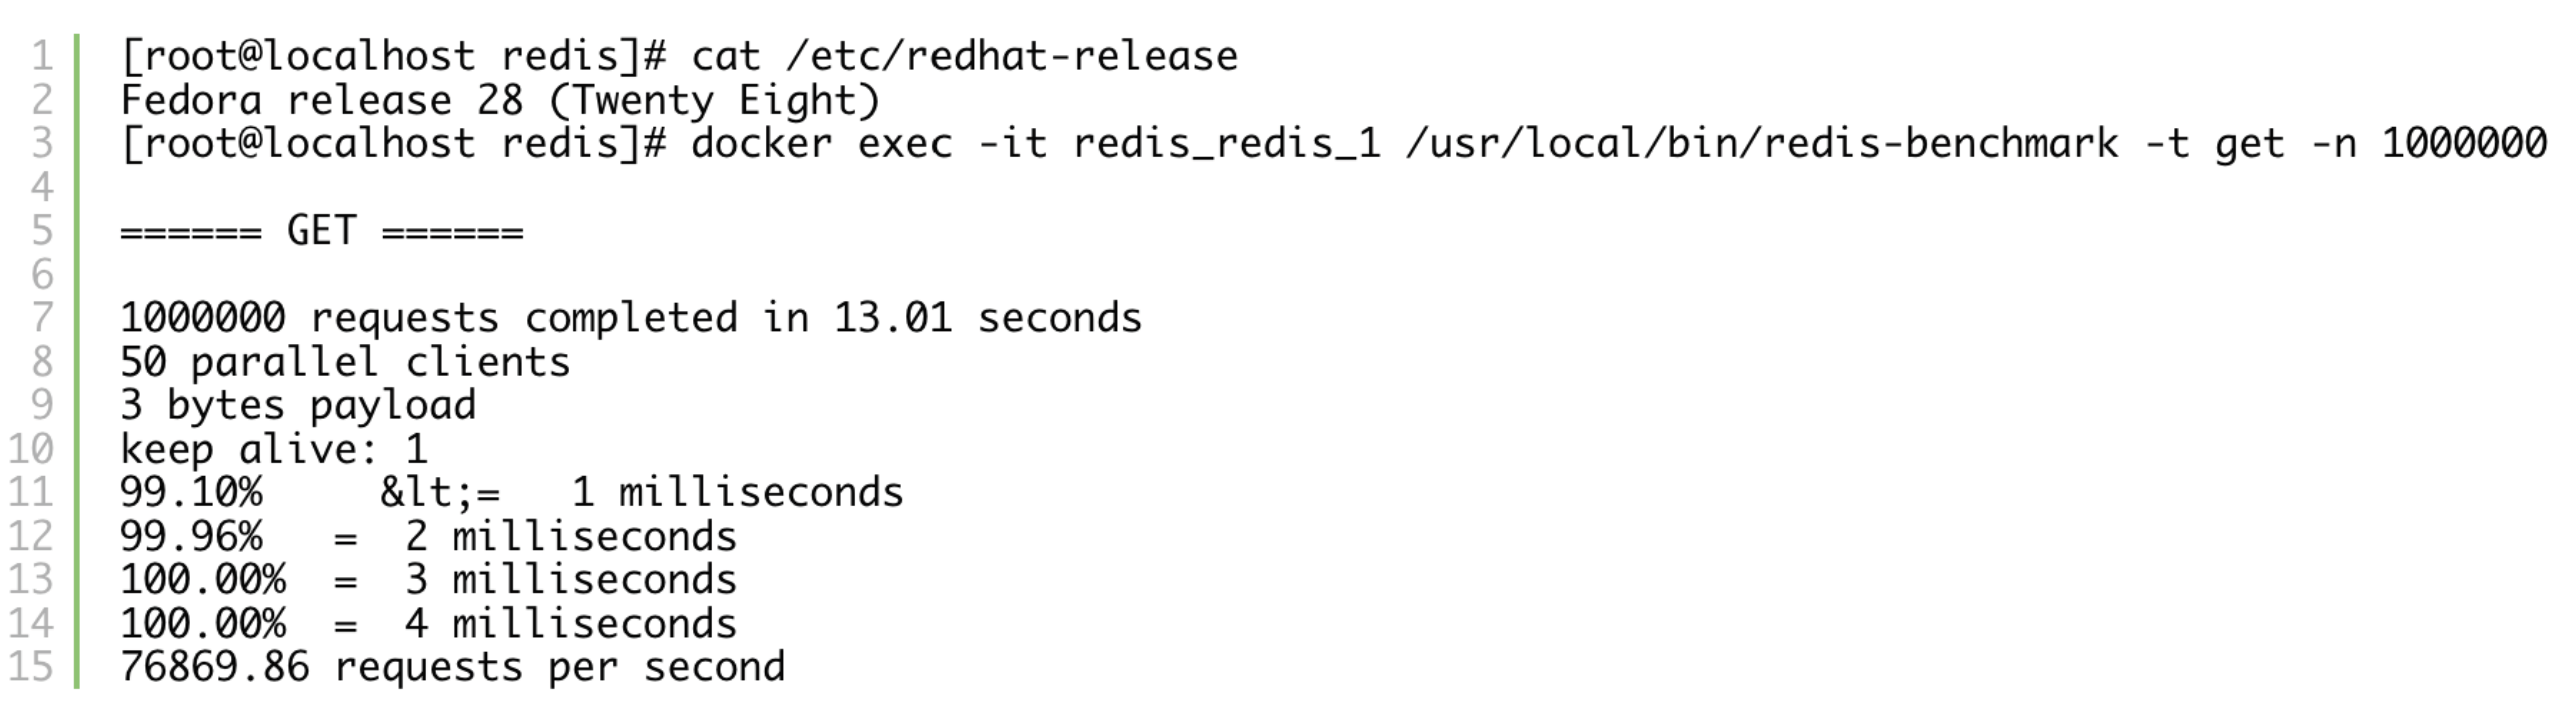
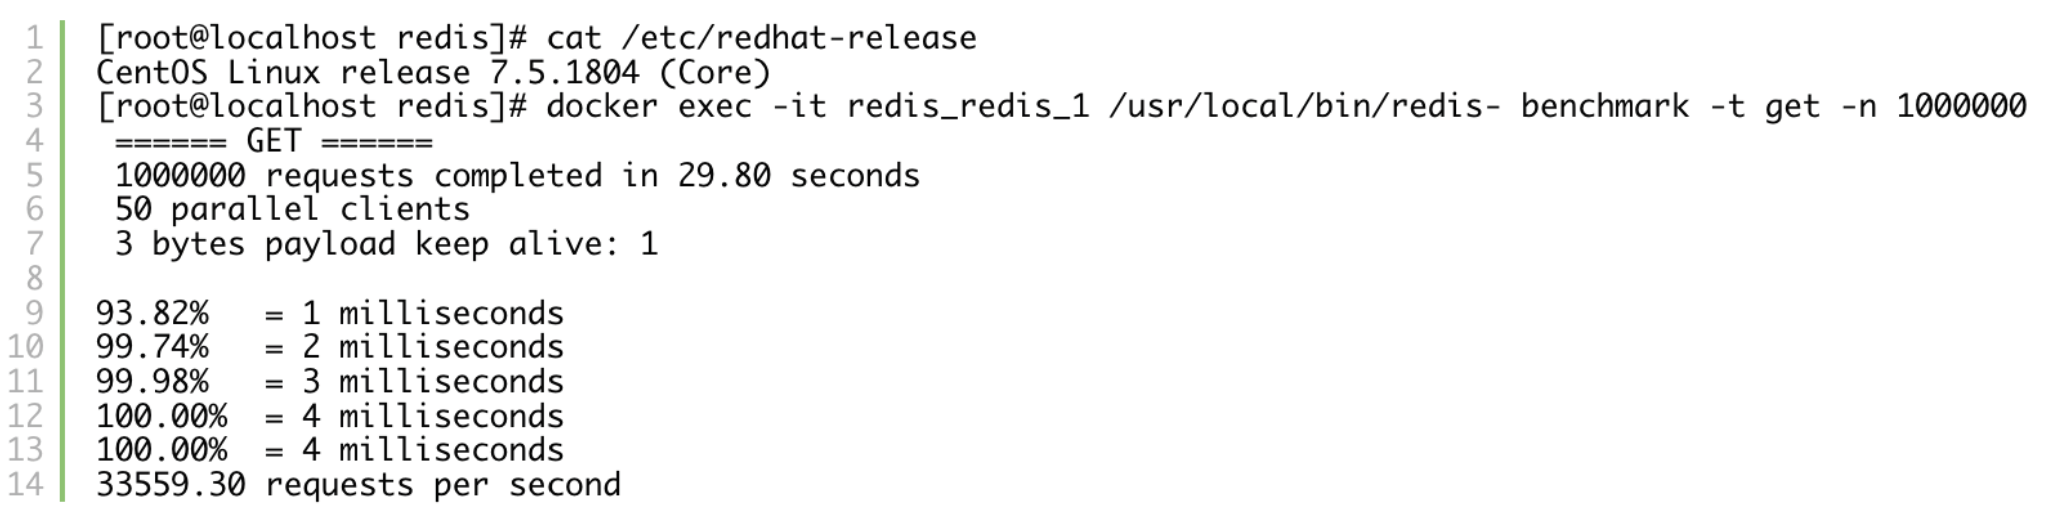
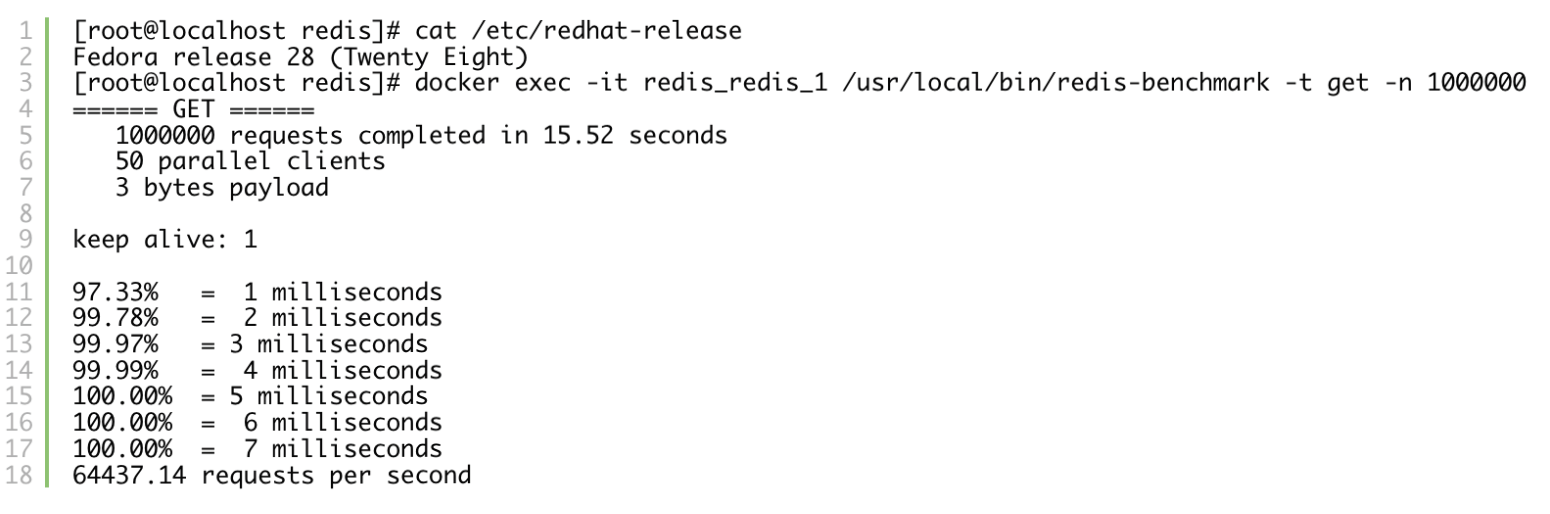
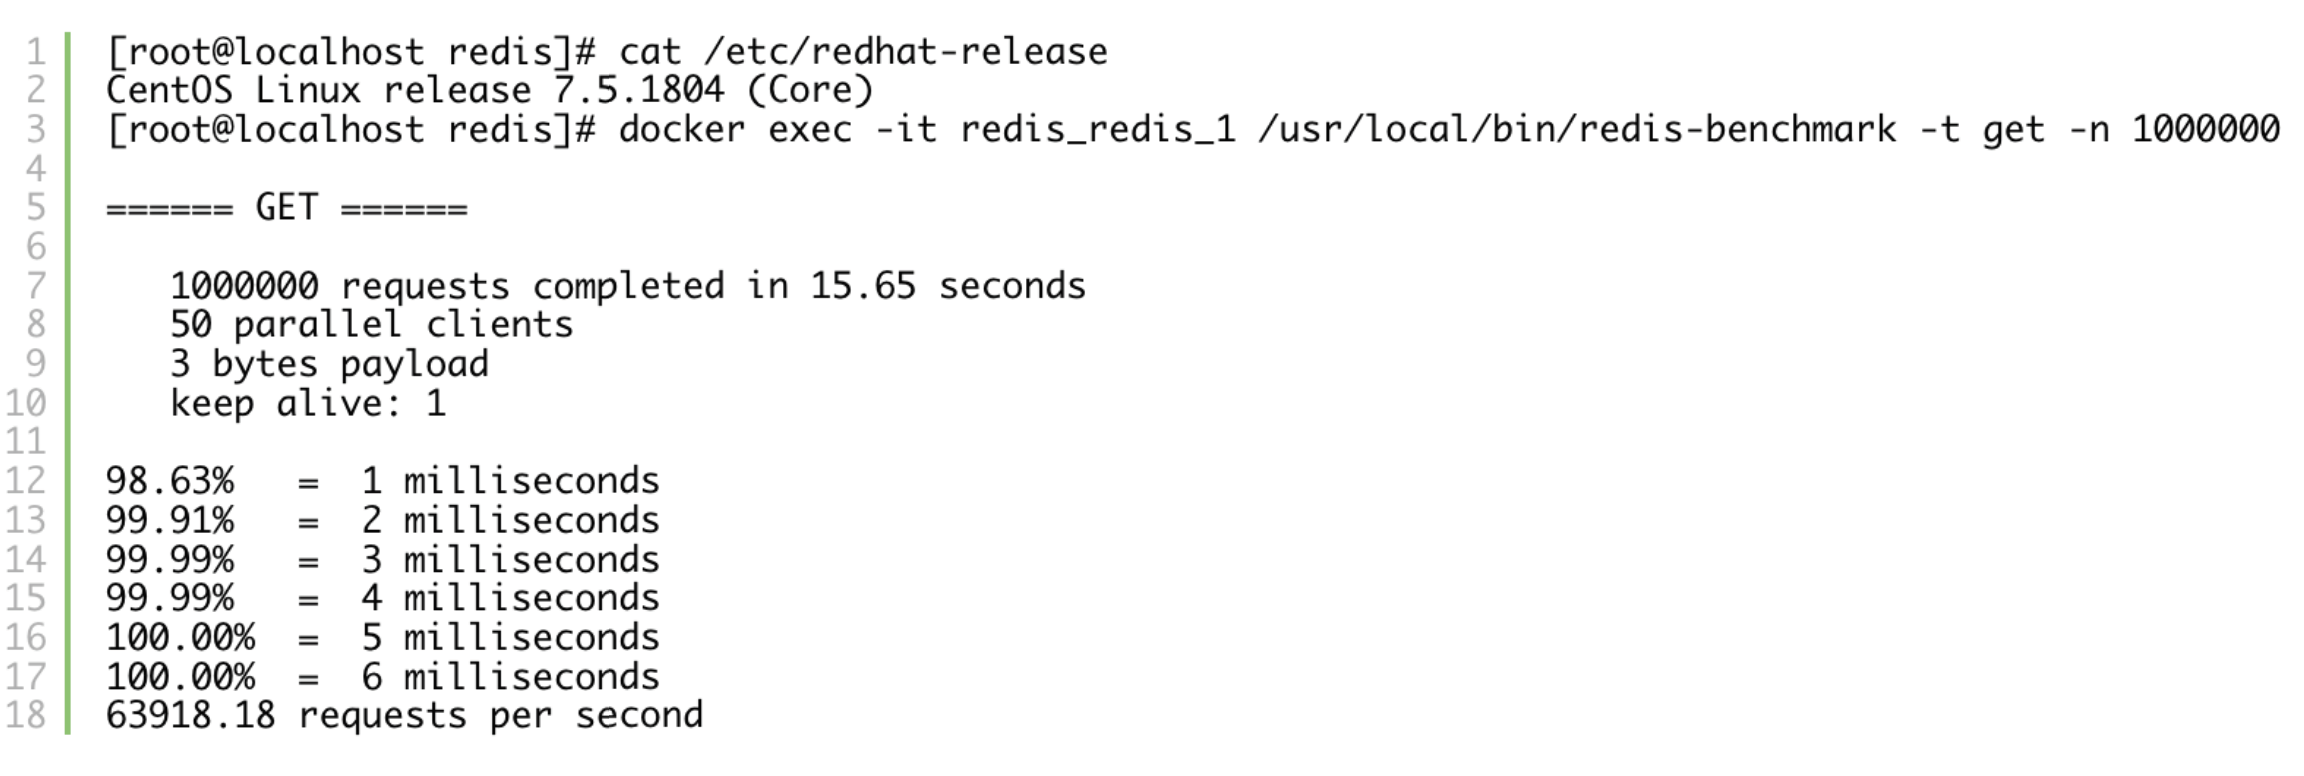
Our infrastructure runs on CentOS, but developers are free to use whatever OS they desire. As it happens, we had a laptop running Fedora (28) where we could compare the performance of containerized Redis to the production environment. The main test we’ll be looking into is redis-benchmark, and the results of that test surprised everyone.
Check it yourself (the benchmark is only set to get to keep the examples shorter, but this behavior is reproducible across all commands):
Fedora 28:
CentOS 7.5:
Docker version is similar:
Fedora:

CentOS:

Digging Deeper
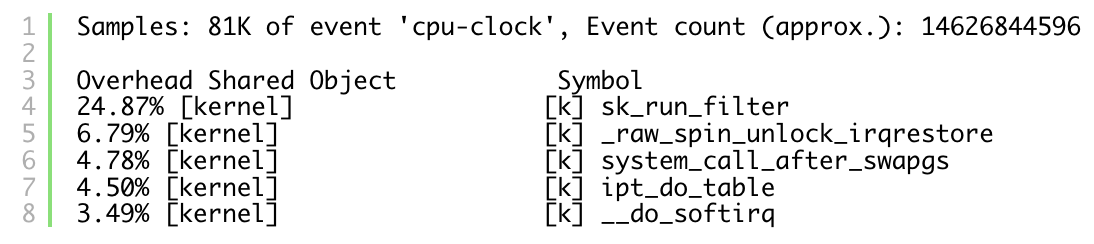
Redis on CentOS could only deliver slightly over 1/3 of “gets per second” that we would see on Fedora. Also consider that Fedora was on an older laptop, whereas CentOS is running on a beefy machine within a datacenter. Let’s investigate what is going on within the system by using kernel’s perf framework. Whenever using perf, the default step should be looking at the top subcommand.
CentOS:
Fedora:
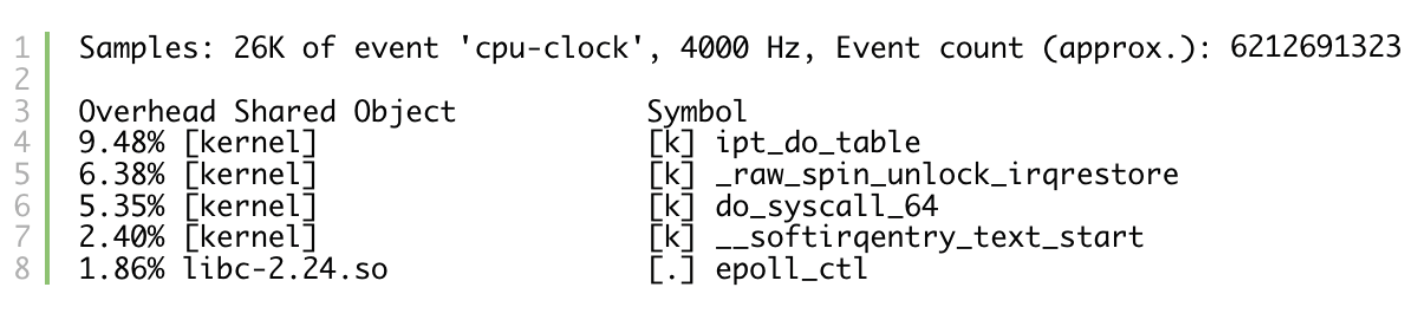
By comparing the output of perf top on these machines, it seems that Redis on CentOS is spending most of the CPU cycles in sk_run_filter. What even is sk_run_filter? Let’s head into the kernel. Luckily (at least this time) sk_run_filter isn’t a secret per se, as according to the documentation it is one of the calls when running a process under seccomp (see more at lwn).
One possible solution at this point would be switching the Redis server to Fedora and we’re done, but that comes at two expenses:
- no one wants to manage Fedora in production
- we still don’t understand the cause of the problem
Resolution
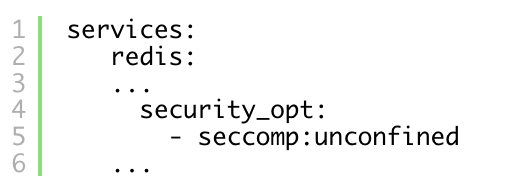
Dismantling docker src RPMs on both systems doesn’t point out any difference in the used seccomp profile, which narrows our search down to the main culprit: kernel. As the changelog between 3.10 used in CentOS and 4.18 used in Fedora 28 is seemingly endless, we’ve decided against tracking the specific change that hinders the performance, and opted in for a simpler solution: disable seccomp for Redis containers.
Disabling seccomp is a matter of single step, in case of docker
![]()
or in case of docker-compose:
After disabling seccomp for Redis container, the results look like we initially expected:
Fedora:
CentOS:
Would you like to work with us?
Would you be interested in solving multidisciplinary problems? We’re always on the lookout for problem solvers looking to get their hands dirty with challenges brought to us by software and modern infrastructure.
For available positions, see careers or contact us directly at career@threatmark.com if your position doesn’t exist (yet).
Martin Polednik
Related Articles
-
 November 21, 2025
Germany’s New Fraud Reality: Inside a Rapidly Evolving Scam Landscape
Germany is facing one of Europe’s fastest-rising scam and cybercrime waves, from deepfake investment ads to large-scale fraud...
November 21, 2025
Germany’s New Fraud Reality: Inside a Rapidly Evolving Scam Landscape
Germany is facing one of Europe’s fastest-rising scam and cybercrime waves, from deepfake investment ads to large-scale fraud...
-
 October 8, 2024
Spain’s Cybercrime Problem: What Banks Should Learn from the Santander Data Breach
Spain recently made headlines when one of its largest banks, Santander, fell victim to a hacker attack. This...
October 8, 2024
Spain’s Cybercrime Problem: What Banks Should Learn from the Santander Data Breach
Spain recently made headlines when one of its largest banks, Santander, fell victim to a hacker attack. This...
-
 June 14, 2024
Overcoming Latin America’s Digital Fraud Challenges
Latin America is among the regions most troubled by payment fraud worldwide.
This success of fraudsters stems from multiple...
June 14, 2024
Overcoming Latin America’s Digital Fraud Challenges
Latin America is among the regions most troubled by payment fraud worldwide.
This success of fraudsters stems from multiple...